Education
About Us
Working with TipRanks
Follow Us


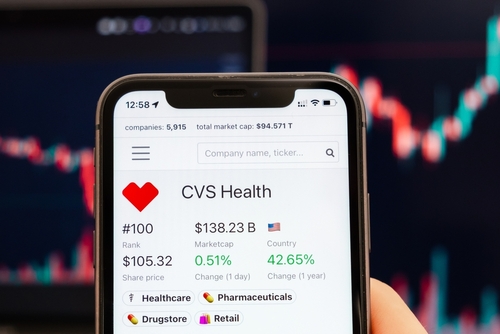
CVS Health Corp (CVS)
NYSE:CVS
CVS Stock Chart & Stats
Day’s Range― - ―
52-Week Range$43.56 - $80.75
Previous CloseN/A
Volume5.40M
Average Volume (3M)10.41M
Market Cap
$84.54B
Enterprise Value$152.29B
Total Cash (Recent Filing)$9.80B
Total Debt (Recent Filing)$81.79B
Price to Earnings (P/E)18.3
Beta0.55
Next Earnings
May 01, 2025EPS Estimate
1.64Next Dividend Ex-Date
Apr 22, 2025Dividend Yield3.97%
Share Statistics
EPS (TTM)3.66
Shares Outstanding1,260,795,000
10 Day Avg. Volume9,248,726
30 Day Avg. Volume10,405,049
Financial Highlights & Ratios
PEG RatioN/A
Price to Book (P/B)N/A
Price to Sales (P/S)0.23
Price to Cash Flow (P/CF)11.40
P/FCF Ratio9.00
Enterprise Value/Market Cap1.80
Enterprise Value/RevenueN/A
Enterprise Value/Gross Profit2.96
Enterprise Value/Ebitda11.11
Forecast
1Y Price Target
$73.44Price Target Upside10.47% Upside
Rating ConsensusStrong Buy
Number of Analyst Covering19
---


Bulls Say, Bears Say
Bulls Say
Earnings GrowthCVS reported good Q4:24 results with adjusted EPS of $1.19 beating consensus estimates by 29%.
ProfitabilityThe new smaller store format can lower rent and improve working capital, driving better profitability per store over time.
ValuationThe stock remains at a discounted level compared to historical ranges, offering potential for growth.
Bears Say
Operating LossThe Health Care Benefits segment experienced an adjusted operating loss of $439 million, although it was better than expected.
Regulatory ConcernsA DOJ investigation into peer UNH and its Medicare billing practices will create a near-term sentiment disruption.
Revenue DeclineIn the Health Services segment, revenues declined by 4.3% due to the loss of a large client and ongoing client price improvements.
---
Ownership Overview
1.03% Insiders
29.36% Mutual Funds
28.50% Other Institutional Investors
20.31% Public Companies and
Individual Investors
Risk Analysis
Main Risk Category
Ability to SellRisks related to the company’s ability to sell goods and services
Website Traffic
The estimated number of people who visited one or more of the websites owned by CVS Health
Desktop Users
Mobile Users
CVS FAQ
What was CVS Health Corp’s price range in the past 12 months?
CVS Health Corp lowest stock price was $43.56 and its highest was $80.75 in the past 12 months.
What is CVS Health Corp’s market cap?
CVS Health Corp’s market cap is $84.54B.
When is CVS Health Corp’s upcoming earnings report date?
CVS Health Corp’s upcoming earnings report date is May 01, 2025 which is in 36 days.
How were CVS Health Corp’s earnings last quarter?
CVS Health Corp released its earnings results on Feb 12, 2025. The company reported $1.19 earnings per share for the quarter, beating the consensus estimate of $0.914 by $0.276.
Is CVS Health Corp overvalued?
According to Wall Street analysts CVS Health Corp’s price is currently Undervalued.
Does CVS Health Corp pay dividends?
CVS Health Corp pays a Quarterly dividend of $0.665 which represents an annual dividend yield of 3.97%. See more information on CVS Health Corp dividends here
What is CVS Health Corp’s EPS estimate?
CVS Health Corp’s EPS estimate is 1.64.
How many shares outstanding does CVS Health Corp have?
CVS Health Corp has 1,260,795,000 shares outstanding.
What happened to CVS Health Corp’s price movement after its last earnings report?
CVS Health Corp reported an EPS of $1.19 in its last earnings report, beating expectations of $0.914. Following the earnings report the stock price went up 14.945%.
Which hedge fund is a major shareholder of CVS Health Corp?
Currently, no hedge funds are holding shares in CVS
---
CVS Health Stock Smart Score
Outperform
1
2
3
4
5
6
7
8
9
10
Analyst Consensus
Strong Buy
Average Price Target:
$73.44 (10.47% Upside)
$73.44 (10.47% Upside)
Blogger Sentiment
Bullish
CVS Sentiment 72%
Sector Average 69%
Sector Average 69%
Hedge Fund Trend
Increased
By 25.4M Shares
Last Quarter.
Last Quarter.
Insider Transactions
Bought Shares
Worth $1.5M over
the Last 3 Months
the Last 3 Months
Crowd Wisdom
Very Negative
Last 7 Days ▼ 0.2%
Last 30 Days ▼ 4.9%
Last 30 Days ▼ 4.9%
News Sentiment
Neutral
Bullish news 50%
Bearish news 50%
Bearish news 50%
Technicals
SMA
Positive
20 days / 200 days
Momentum
-9.97%
12-Months-Change
Fundamentals
Return on Equity
6.07%
Trailing 12-Months
Asset Growth
1.20%
Trailing 12-Months
Company Description
CVS Health Corp
CVS Health Corporation provides health services in the United States. The company's Health Care Benefits segment offers traditional, voluntary, and consumer-directed health insurance products and related services. It serves employer groups, individuals, college students, part-time and hourly workers, health plans, health care providers, governmental units, government-sponsored plans, labor groups, and expatriates. Its Pharmacy Services segment offers pharmacy benefit management solutions, including plan design and administration, formulary management, retail pharmacy network management, mail order pharmacy, specialty pharmacy and infusion, clinical, and disease and medical spend management services. It serves employers, insurance companies, unions, government employee groups, health plans, prescription drug plans, Medicaid managed care plans, plans offered on public health insurance and private health insurance exchanges, other sponsors of health benefit plans, and individuals. This segment operates retail specialty pharmacy stores; and specialty mail-order, mail-order dispensing, and compounding pharmacies, as well as branches for infusion and enteral nutrition services. The company's Retail/LTC segment sells prescription and over-the-counter drugs, consumer health and beauty products, and personal care products; and provides health care services through its MinuteClinic walk-in medical clinics. This segment also distributes prescription drugs; and provides related pharmacy consulting and other ancillary services to care facilities and other care settings. As of December 31, 2021, it operated approximately 9,900 retail locations and 1,200 MinuteClinic locations, as well as online retail pharmacy websites, LTC pharmacies, and onsite pharmacies. The company was formerly known as CVS Caremark Corporation and changed its name to CVS Health Corporation in September 2014. CVS Health Corporation was founded in 1963 and is headquartered in Woonsocket, Rhode Island.
---
CVS Company Deck
---
CVS Earnings Call
Q4 2025
0:00 / 0:00
Earnings Call Sentiment|Neutral
The earnings call reflects a mixed sentiment with notable achievements in revenue growth, Aetna stabilization, and market leadership in biosimilars. However, challenges remain with ongoing issues in Medicare Advantage and individual exchange losses, compounded by elevated medical trends and pressure on pharmacy operating income.Read More>---
CVS Revenue Breakdown
46.57% Health Services
35.05% Health Care Benefits
33.40% Pharmacy & Consumer Wellness
0.12% Corporate/ Other
---
CVS Stock 12 Month Forecast
Average Price Target
$73.44
▲(10.47% Upside)
Technical Analysis
Best Analysts Covering CVS
1 Year
1 Year Success Rate
11/17 ratings generated profit
1 Year Average Return
+8.70%
reiterated a buy rating 14 days ago
Copying Elizabeth Anderson CFA's trades and holding each position for 1 Year would result in 64.71% of your transactions generating a profit, with an average return of +8.70% per trade.
---