Education
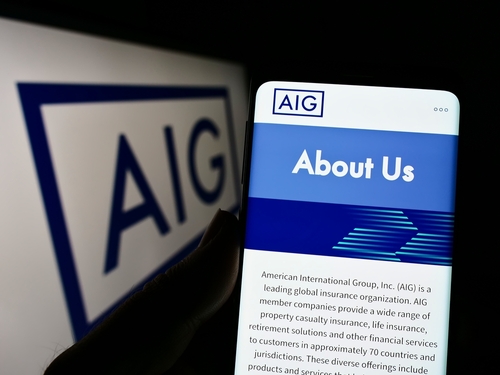
About Us
Working with TipRanks
Follow Us


American International Group (AIG)
NYSE:AIG
RESEARCH TOOLSreports
AIG Stock Chart & Stats
Day’s Range― - ―
52-Week Range$69.00 - $88.07
Previous CloseN/A
Volume2.30M
Average Volume (3M)6.30M
Market Cap
$47.58B
Enterprise Value$55.49B
Total Cash (Recent Filing)$2.13B
Total Debt (Recent Filing)$139.43B
Price to Earnings (P/E)16.1
Beta0.58
Next Earnings
May 01, 2025Last Dividend Ex-Date
Mar 17, 2025Dividend Yield1.96%
Share Statistics
EPS (TTM)5.05
Shares Outstanding583,773,130
10 Day Avg. Volume6,429,833
30 Day Avg. Volume6,300,639
Financial Highlights & Ratios
PEG Ratio14.17
Price to Book (P/B)N/A
Price to Sales (P/S)1.49
Price to Cash Flow (P/CF)6.50
P/FCF Ratio0.00
Enterprise Value/Market Cap1.17
Enterprise Value/RevenueN/A
Enterprise Value/Gross Profit2.03
Enterprise Value/Ebitda6.56
Forecast
1Y Price Target
$88.47Price Target Upside7.96% Upside
Rating ConsensusModerate Buy
Number of Analyst Covering17
---

Bulls Say, Bears Say
Bulls Say
Expense RatiosAIG's investor day presentation points to better expense ratios than consensus.
Growth And EarningsManagement focused on how technology will enable the next leg of growth and earnings.
Bears Say
Pricing PowerPricing-power within the large employer marketplace where AIG primarily operates continues to be 'soft,' possibly resulting in margin pressure.
Return On EquityAnalyst's forecasted return on equity for AIG is reduced to approximately 11.6% from an earlier estimate of around 13%.
---
Ownership Overview
0.21% Insiders
36.72% Mutual Funds
0.32% Other Institutional Investors
39.57% Public Companies and
Individual Investors
Risk Analysis
Main Risk Category
Finance & CorporateFinancial and accounting risks. Risks related to the execution of corporate activity and strategy
Website Traffic
 Sorry, No Data Available
There is no website visitor data available for this stock.
---
AIG FAQ
What was American International Group’s price range in the past 12 months?
American International Group lowest stock price was $69.00 and its highest was $88.07 in the past 12 months.
What is American International Group’s market cap?
American International Group’s market cap is $47.58B.
When is American International Group’s upcoming earnings report date?
American International Group’s upcoming earnings report date is May 01, 2025 which is in 15 days.
How were American International Group’s earnings last quarter?
American International Group released its earnings results on Feb 11, 2025. The company reported $1.3 earnings per share for the quarter, beating the consensus estimate of $1.235 by $0.065.
Is American International Group overvalued?
According to Wall Street analysts American International Group’s price is currently Undervalued.
Does American International Group pay dividends?
American International Group pays a Quarterly dividend of $1.6 which represents an annual dividend yield of 1.96%. See more information on American International Group dividends here
What is American International Group’s EPS estimate?
American International Group’s EPS estimate is 1.
How many shares outstanding does American International Group have?
American International Group has 583,773,130 shares outstanding.
What happened to American International Group’s price movement after its last earnings report?
American International Group reported an EPS of $1.3 in its last earnings report, beating expectations of $1.235. Following the earnings report the stock price went up 1.231%.
Which hedge fund is a major shareholder of American International Group?
Currently, no hedge funds are holding shares in AIG
---
American International Group Stock Smart Score
Outperform
1
2
3
4
5
6
7
8
9
10
Analyst Consensus
Moderate Buy
Average Price Target:
$88.47 (7.96% Upside)
$88.47 (7.96% Upside)
Blogger Sentiment
Bullish
AIG Sentiment 85%
Sector Average 68%
Sector Average 68%
Hedge Fund Trend
Decreased
By 123.2K Shares
Last Quarter.
Last Quarter.
Insider Transactions
Bought Shares
Worth $820.6K over
the Last 3 Months
the Last 3 Months
Crowd Wisdom
Neutral
Last 7 Days ▲ 0.3%
Last 30 Days ▲ 0.2%
Last 30 Days ▲ 0.2%
News Sentiment
Neutral
Bullish news 50%
Bearish news 50%
Bearish news 50%
Technicals
SMA
Positive
20 days / 200 days
Momentum
12.98%
12-Months-Change
Fundamentals
Return on Equity
7.10%
Trailing 12-Months
Asset Growth
-73.87%
Trailing 12-Months
Company Description
American International Group
American International Group, Inc. (AIG) is a global insurance organization providing a wide range of property casualty insurance, life insurance, retirement solutions, and other financial services to customers in more than 80 countries and jurisdictions. Founded in 1919 and headquartered in New York City, AIG serves individuals and businesses with products and services designed to manage risk and provide for a secure future.
---
AIG Company Deck
---
AIG Earnings Call
Q4 2025
0:00 / 0:00
Earnings Call Sentiment|Positive
The earnings call presented a strong performance in terms of underwriting and strategic initiatives, with significant capital management achievements. However, increased catastrophe losses and expense management challenges slightly tempered the overall positive outlook.Read More>---
AIG Revenue Breakdown
52.18% International
47.82% North America
---
AIG Stock 12 Month Forecast
Average Price Target
$88.47
▲(7.96% Upside)
Technical Analysis
Aegon
―
Arch Capital Group
―
Hartford Financial
―
Principal Financial
―
Equitable Holdings
―
Best Analysts Covering AIG
1 Year
1 Year Success Rate
14/14 ratings generated profit
1 Year Average Return
+14.44%
reiterated a buy rating 2 months ago
Copying Scott Heleniak's trades and holding each position for 1 Year would result in 100.00% of your transactions generating a profit, with an average return of +14.44% per trade.
---