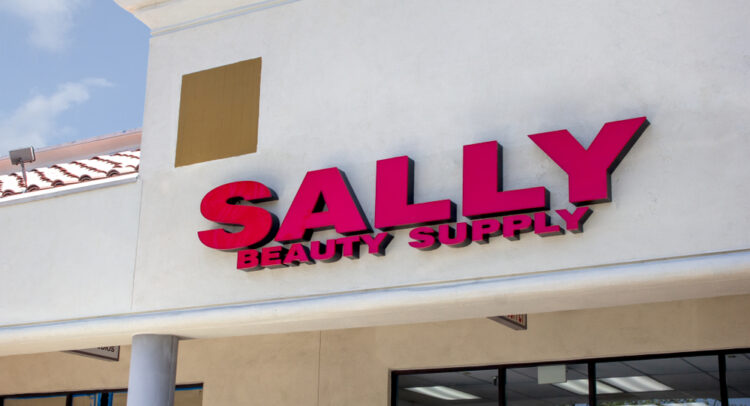
Sally Beauty Holdings (SBH)
NYSE:SBH
Earnings Data
Report Date
May 01, 2025TBA Not Confirmed
Period Ending
2025 (Q2)Consensus EPS Forecast
0.39Last Year’s EPS
0.35Same Quarter Last Year
Moderate Buy
Based on 5 Analysts Ratings
---
Earnings Call Summary
Earnings Call Date:Feb 13, 2025
|% Change Since: -9.37%
|Next Earnings Date:May 01, 2025
Earnings Call Sentiment|Neutral
Sally Beauty Holdings reported solid Q1 results with consistent sales growth and improved profitability driven by strategic initiatives and strong e-commerce performance. However, the company faced challenges from foreign currency headwinds and a difficult macroeconomic environment, which influenced flat guidance for the second quarter.Company Guidance
During the first quarter of fiscal 2025, Sally Beauty Holdings reported several positive metrics, reflecting continued business momentum in both the Sally and BSG segments. Comparable sales grew by 1.6%, marking the fifth and third consecutive quarters of positive comps for BSG and Sally, respectively. Despite a 60 basis point headwind from foreign exchange, consolidated net sales saw a 0.7% increase, reaching $938 million. The gross margin expanded by 60 basis points to 50.8%, attributed to reduced shrink and lower distribution costs. Operating margin improved by 50 basis points to 8.4%, while adjusted diluted EPS rose by 10% to $0.43. Sally's segment achieved a 1.7% increase in comparable sales, with e-commerce sales growing 18% year-over-year. BSG also exhibited strength with a 1.4% rise in comparable sales. Looking ahead, the company maintains its full-year guidance for comparable sales growth in the range of flat to up 2%, despite anticipating a flat comp in fiscal Q2 due to macroeconomic and environmental factors.Consistent Sales Growth
The company reported a third consecutive quarter of positive top line performance in both Sally and BSG segments, with consolidated net sales of $938 million, representing an increase of 0.7%.
Improved Profitability
Adjusted operating margin increased by 50 basis points to 8.4%, and adjusted diluted EPS was up 10% to $0.43 compared to the prior year.
Successful Strategic Initiatives
The Fuel for Growth program delivered approximately $11 million in pretax benefits, contributing to gross margin and SG&A improvements.
Strong E-commerce Performance
Global e-commerce sales were $99 million, up 9% year-over-year, representing 11% of total net sales.
Introduction of K18 Brand
BSG announced the launch of the premium hair care brand K18 in all stores and e-commerce in the U.S. and Canada, expected on April 1.
---
SBH Earnings History
The table shows recent earnings report dates and whether the forecast was beat or missed. See the change in forecast and EPS from the previous year.
Beat
Missed
---
SBH Earnings-Related Price Changes
Report Date | Price 1 Day Before | Price 1 Day After | Percentage Change |
|---|---|---|---|
| Feb 13, 2025 | $9.18 | $9.59 | +4.47% |
| Nov 14, 2024 | $12.53 | $13.78 | +9.98% |
| Aug 08, 2024 | $9.39 | $10.30 | +9.69% |
| May 09, 2024 | $10.82 | $10.34 | -4.44% |
Earnings announcements can affect a stock’s price. This table shows the stock's price the day before and the day after recent earnings reports, including the percentage change.
---
FAQ
When does Sally Beauty Holdings (SBH) report earnings?
Sally Beauty Holdings (SBH) is schdueled to report earning on May 01, 2025, TBA Not Confirmed.
What is Sally Beauty Holdings (SBH) earnings time?
Sally Beauty Holdings (SBH) earnings time is at May 01, 2025, TBA Not Confirmed.
Where can I see when companies are reporting earnings?
You can see which companies are reporting today on our designated earnings calendar.
What companies are reporting earnings today?
You can see a list of the companies which are reporting today on TipRanks earnings calendar.
What is SBH EPS forecast?
SBH EPS forecast for the fiscal quarter 2025 (Q2) is 0.39.
---


