Education
About Us
Working with TipRanks
Follow Us


SG:HD9 ETF Price & Analysis
HD9 ETF Chart & Stats
Day’s Range― - ―
52-Week Range$23.55 - $29.20
Previous Close$26.41
VolumeN/A
Average Volume (3M)315.00
AUM267.84M
NAV26.71
Expense Ratio0.85%
Holdings Count98
Beta0.37
Inception DateJan 15, 2008
Next Dividend Ex-DateN/A
Dividend Yield
(―)Shares OutstandingN/A
Standard DeviationN/A
10 Day Avg. Volume196
30 Day Avg. Volume315
AlphaN/A
ETF Overview
Xtrackers FTSE VIETNAM SWAP UCITS ETF Capitalisation 1C
The Xtrackers FTSE VIETNAM SWAP UCITS ETF Capitalisation 1C (Ticker: SG:HD9) provides investors with a unique opportunity to gain exposure to the dynamic Vietnamese market, focusing specifically on large-cap companies. As a size and style-focused fund, it targets the upper echelon of Vietnamese enterprises, capturing the economic vigor of one of Southeast Asia's most rapidly developing economies. This ETF is designed for those looking to diversify their portfolio with broad-based yet concentrated investments in Vietnam's leading corporations, offering a strategic blend of growth potential and market stability. The fund employs a swap-based strategy to replicate the performance of the FTSE Vietnam Index, ensuring precise and efficient tracking of its benchmark. By investing in the Xtrackers FTSE VIETNAM SWAP UCITS ETF, investors can partake in the promising trajectory of Vietnam's economic landscape, characterized by robust industrial growth, a burgeoning middle class, and a favorable demographic structure, all while maintaining a focus on large-cap equities that stand at the forefront of this transformative market.
Xtrackers FTSE VIETNAM SWAP UCITS ETF Capitalisation 1C (HD9) Fund Flow Chart
Xtrackers FTSE VIETNAM SWAP UCITS ETF Capitalisation 1C (HD9) 1 year Net Flows: -$52M
HD9 ETF News
PremiumCompany Announcements
Xtrackers Announces 2025 AGM with Key Financial and Governance AgendaPremiumCompany Announcements
Xtrackers Releases Mid-Year Financial UpdatePremiumCompany Announcements
Xtrackers Schedules AGM to Discuss 2023 Results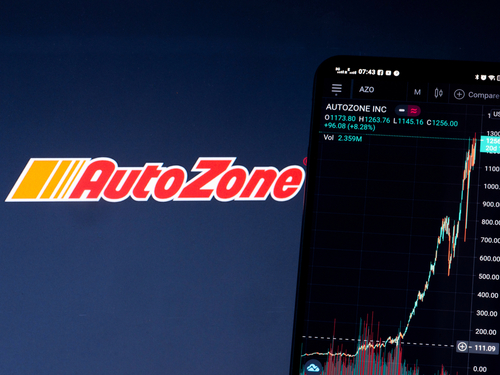
PremiumInsider Trading
AutoZone CEO Makes Multi-Million Dollar Stock Move!See More SG:HD9 News
HD9 ETF FAQ
What was SG:HD9’s price range in the past 12 months?
SG:HD9 lowest ETF price was $23.55 and its highest was $29.20 in the past 12 months.
What is the AUM of SG:HD9?
As of Mar 27, 2025 The AUM of SG:HD9 is 267.84M.
Is SG:HD9 overvalued?
According to Wall Street analysts SG:HD9’s price is currently Undervalued.
Does SG:HD9 pay dividends?
SG:HD9 does not currently pay dividends.
How many shares outstanding does SG:HD9 have?
Currently, no data Available
Which hedge fund is a major shareholder of SG:HD9?
Currently, no hedge funds are holding shares in SG:HD9
HD9 ETF Smart Score
Neutral
1
2
3
4
5
6
7
8
9
10
Learn more about TipRanks Smart Score
For ETFs, the calculations for the Smart Score, Analyst Consensus, Price Target, Blogger Sentiment, News Sentiment and Insider Transactions are based on the weighted average of the ETF's holdings and some additional factors. Hedge Fund Trend, Crowd Wisdom and Technicals are based on the actual ETF ticker.
Top 10 Holdings
Apple Inc
6.80%
Microsoft
6.36%
Tesla Motors
6.06%
Amazon.Com, Inc.
6.00%
Berkshire Hathaway B
5.69%
Palantir Technologies Inc.
4.87%
S&P Global
4.73%
AutoZone Inc
2.67%
Alphabet Inc. Class A
2.48%
Liberty Broadband
2.35%
Total48.03%
See All Holdings