Earnings Calendar - Oct 13, 2022
Showing earnings announcements on Oct 13, 2022
Name | Company | Market Cap | EPS (Forecast) | EPS (Actual) | Revenue (Forecast) | Revenue (Actual) | Time | Analyst Consensus | Smart Score | Follow |
|---|---|---|---|---|---|---|---|---|---|---|
| TSMC | $866.06B | $1.65 | $19.44B | ― | xxxxxxxxxxxxx | |||||
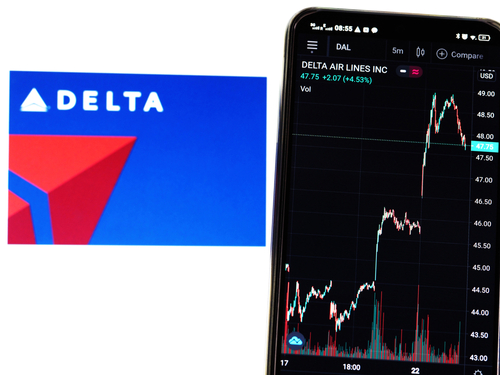
| Delta Air Lines | $38.76B | $1.53 | $12.86B | xxxxxxxxxxxxx | ||||||
| Walgreens Boots Alliance | $8.78B | $0.77 | $32.09B | xxxxxxxxxxxxx | ||||||
| BlackRock | $150.89B | $7.06 | $4.20B | xxxxxxxxxxxxx | ||||||
| Domino's Pizza | $15.97B | $2.97 | $1.07B | xxxxxxxxxxxxx | ||||||
| Infosys | $86.98B | $0.17 | $4.50B | xxxxxxxxxxxxx | ||||||
| Progressive | $155.94B | $1.04 | $13.29B | xxxxxxxxxxxxx | ||||||
| Fastenal Company | $42.88B | $0.48 | $1.79B | xxxxxxxxxxxxx | ||||||
| Esports Entertainment Group | $263.81K | -$7.20K | $11.18M | xxxxxxxxxxxxx | ||||||
| Commercial Metals Company | $5.66B | $2.22 | $2.38B | xxxxxxxxxxxxx | ||||||
| Biomerica | $15.38M | ― | ― | xxxxxxxxxxxxx | ||||||
| Oil-Dri Of America | $509.10M | ― | ― | xxxxxxxxxxxxx | ||||||
| Karooooo | $1.44B | $0.26 | $44.35M | xxxxxxxxxxxxx | ||||||
| Cass Information Systems | $585.92M | ― | ― | xxxxxxxxxxxxx | ||||||
| Bank Of South Carolina | $76.11M | ― | ― | xxxxxxxxxxxxx | ||||||
| Washington Federal | $2.39B | $0.91 | $171.30M | xxxxxxxxxxxxx | ||||||
| Schmitt Industries | $70.09K | ― | ― | ― | ― | ― | xxxxxxxxxxxxx | |||
| Bravada International | $1.88K | ― | ― | ― | xxxxxxxxxxxxx | |||||
| Burnham Holdings | $62.72M | ― | ― | ― | xxxxxxxxxxxxx |
Rows:
Earnings News
FAQ
When is Earnings Season?
The earnings season usually begins one to two weeks after the end of the last month of each quarter (December, March, June, and September).
How do earnings affect stock prices?
A company's earnings report reveals its profitability and financial stability. If a company’s earnings are reported above expectations, its stock price tends to rise. However, depending on forward guidance and macroeconomic factors, a stock price is still susceptible to volatility.
Is it better to buy a stock before or after earnings?
Stock prices tend to be more volatile before and after a company reports its earnings. Investors should develop an investment thesis using Earnings Reports Insights and other datasets before making any investment decisions.


