
Stocks
ETFs
Options
Commodities
Crypto
Currency
Pro Newsletters
Research Tools
Daily Feeds
Calendars
Economic Indicators
Class Actions
Calculators
Education
About Us
Working with TipRanks
Follow Us
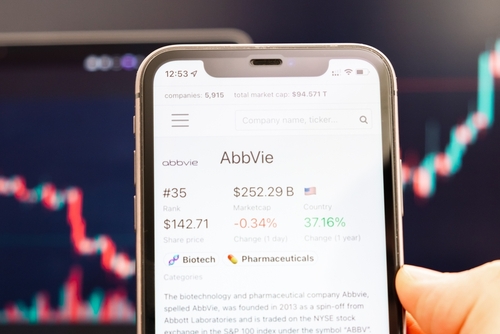
Abbvie (ABBV)
:ABBV
ABBV Stock Chart & Stats
Day’s Range― - ―
52-Week Range$153.58 - $207.32
Previous CloseN/A
Volume1.02M
Average Volume (3M)5.93M
Market Cap
$354.62B
Enterprise Value$376.68B
Total Cash (Recent Filing)N/A
Total Debt (Recent Filing)N/A
Price to Earnings (P/E)84.0
Beta0.24
Next Earnings
Apr 25, 2025EPS Estimate
2.52Next Dividend Ex-Date
Apr 15, 2025Dividend Yield3.13%
Share Statistics
EPS (TTM)2.39
Shares Outstanding1,765,354,900
10 Day Avg. Volume4,588,800
30 Day Avg. Volume5,927,791
Standard Deviation0.07
R-Squared0.19
Alpha0.01
Financial Highlights & Ratios
PEG RatioN/A
Price to Book (P/B)N/A
Price to Sales (P/S)6.30
Price to Cash Flow (P/CF)12.60
P/FCF Ratio11.40
Enterprise Value/Market Cap1.06
Enterprise Value/RevenueN/A
Enterprise Value/Gross ProfitN/A
Enterprise Value/Ebitda15.54
Forecast
1Y Price Target
$207.83Price Target Upside2.85% Upside
Rating ConsensusModerate Buy
Number of Analyst Covering18
---


Bulls Say, Bears Say
Bulls Say
Commercial MomentumABBV raised the 2027 outlook for Skyrizi and Rinvoq revenues to $31B, indicating strong commercial momentum for these brands.
Revenue GrowthSkyrizi and Rinvoq's leading positions in I&I are getting stronger and should yield significant incremental profits for reinvestment in coming years.
Bears Say
Pipeline ChallengesAbbVie's pipeline currently lacks late-stage mega-blockbusters.
---
Ownership Overview
0.08% Insiders
21.95% Mutual Funds
14.57% Other Institutional Investors
42.10% Public Companies and Individual Investors
Risk Analysis
Main Risk Category
Finance & CorporateFinancial and accounting risks. Risks related to the execution of corporate activity and strategy
Website Traffic
 Sorry, No Data Available
There is no website visitor data available for this stock.
---
ABBV FAQ
What was Abbvie’s price range in the past 12 months?
Abbvie lowest stock price was $153.58 and its highest was $207.32 in the past 12 months.
What is Abbvie’s market cap?
Abbvie’s market cap is $354.62B.
When is Abbvie’s upcoming earnings report date?
Abbvie’s upcoming earnings report date is Apr 25, 2025 which is in 62 days.
How were Abbvie’s earnings last quarter?
Abbvie released its earnings results on Jan 31, 2025. The company reported $2.16 earnings per share for the quarter, beating the consensus estimate of $2.115 by $0.045.
Is Abbvie overvalued?
According to Wall Street analysts Abbvie’s price is currently Undervalued.
Does Abbvie pay dividends?
Abbvie pays a Quarterly dividend of $6.286 which represents an annual dividend yield of 3.13%. See more information on Abbvie dividends here
What is Abbvie’s EPS estimate?
Abbvie’s EPS estimate is 2.52.
How many shares outstanding does Abbvie have?
Abbvie has 1,765,354,900 shares outstanding.
What happened to Abbvie’s price movement after its last earnings report?
Abbvie reported an EPS of $2.16 in its last earnings report, beating expectations of $2.115. Following the earnings report the stock price went up 4.697%.
Which hedge fund is a major shareholder of Abbvie?
Currently, no hedge funds are holding shares in ABBV
---
AbbVie Stock Smart Score
Outperform
1
2
3
4
5
6
7
8
9
10
Analyst Consensus
Moderate Buy
Average Price Target:
$207.83 (2.85% Upside)
$207.83 (2.85% Upside)
Blogger Sentiment
Bullish
ABBV Sentiment 70%
Sector Average 70%
Sector Average 70%
Hedge Fund Trend
Increased
By 1.1M Shares
Last Quarter.
Last Quarter.
Insider Transactions
Sold Shares
Worth $310.0K over
the Last 3 Months
the Last 3 Months
Crowd Wisdom
Negative
Last 7 Days ▼ 1.0%
Last 30 Days ▼ 0.7%
Last 30 Days ▼ 0.7%
News Sentiment
Very Bullish
Bullish news 99%
Bearish news 0%
Bearish news 0%
Technicals
SMA
Positive
20 days / 200 days
Momentum
19.58%
12-Months-Change
Fundamentals
Return on Equity
61.94%
Trailing 12-Months
Asset Growth
0.33%
Trailing 12-Months
Company Description
Abbvie
AbbVie, Inc. is a biopharmaceutical company focused on key therapeutic areas like immunology, oncology, neuroscience, eye care, virology, women's health and gastroenterology. The company was founded on October 19, 2011 and is headquartered in North Chicago, IL.
---
ABBV Earnings Call
Q4 2025
0:00 / 0:00
Earnings Call Sentiment|Positive
AbbVie demonstrated strong financial performance in 2024 with notable growth in its ex-Humira platform and advancements in neuroscience and oncology. However, challenges persist with Humira revenue erosion and the aesthetic market facing economic headwinds. Overall, the company is poised for robust growth in 2025 despite these challenges.Read More>---
ABBV Net revenue Breakdown
47.36% Immunology
15.97% Neuroscience
11.86% Other Key Products
11.64% Oncology
13.17% Other
---
ABBV Stock 12 Month Forecast
Average Price Target
$207.83
▲(2.85% Upside)
Technical Analysis
Best Analysts Covering ABBV
1 Year
1 Year Success Rate
18/18 ratings generated profit
1 Year Average Return
+16.79%
reiterated a buy rating 20 days ago
Copying Mohit Bansal's trades and holding each position for 1 Year would result in 100.00% of your transactions generating a profit, with an average return of +16.79% per trade.
---