


The Consumer Price Index for All Urban Consumers is expected to be released today, December 13, 2022 at 08:30 AM EST. Prior to its release, we have compiled a table with some useful information, for your convenience.
What is the Consumer Price Index (CPI)?
The Consumer Price Index (CPI) is a measure of the average change over time in the prices paid by consumers for a basket of goods and services. The CPI is commonly used as an economic indicator to measure inflation, as it shows the change in the cost of living over time. It is calculated by taking the price of a basket of goods and services in a given year and comparing it to the price of the same basket in a base year. The resulting index number can then be used to track changes in the cost of living over time.
What is the Federal Funds Rate?
The federal funds rate is the interest rate at which banks lend money to each other overnight to meet their reserve requirements. The Federal Reserve sets a target for this rate, and uses various tools to influence the supply and demand of money in the economy in order to achieve this target. The CPI is one of the economic indicators that the Federal Reserve takes into account when deciding on the appropriate level for the federal funds rate. If the CPI is rising, it may signal that inflation is increasing, and the Federal Reserve may choose to raise the federal funds rate in order to slow down the economy and keep inflation in check. On the other hand, if the CPI is falling, it may indicate that the economy is slowing down, and the Federal Reserve may lower the federal funds rate to stimulate economic growth.
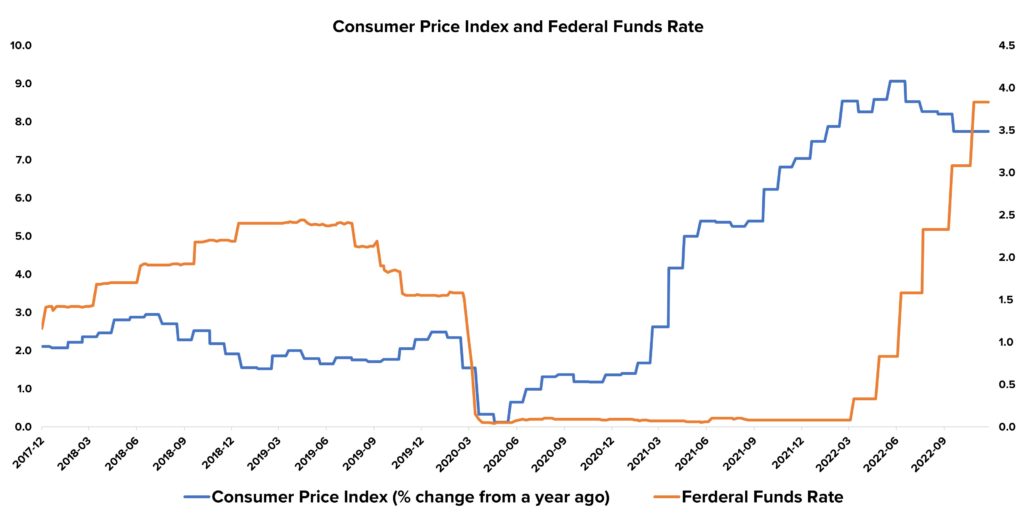
The chart below illustrates the relationship between the Consumer Price Index (CPI) and the Federal Funds Rate. As shown in the chart, changes in the CPI can have an impact on the Federal Funds Rate, as the Federal Reserve may choose to raise or lower the rate in response to changes in inflation. This relationship can be seen in the chart, as periods of higher inflation tend to coincide with higher Federal Funds Rates, and periods of lower inflation tend to coincide with lower Federal Funds Rates
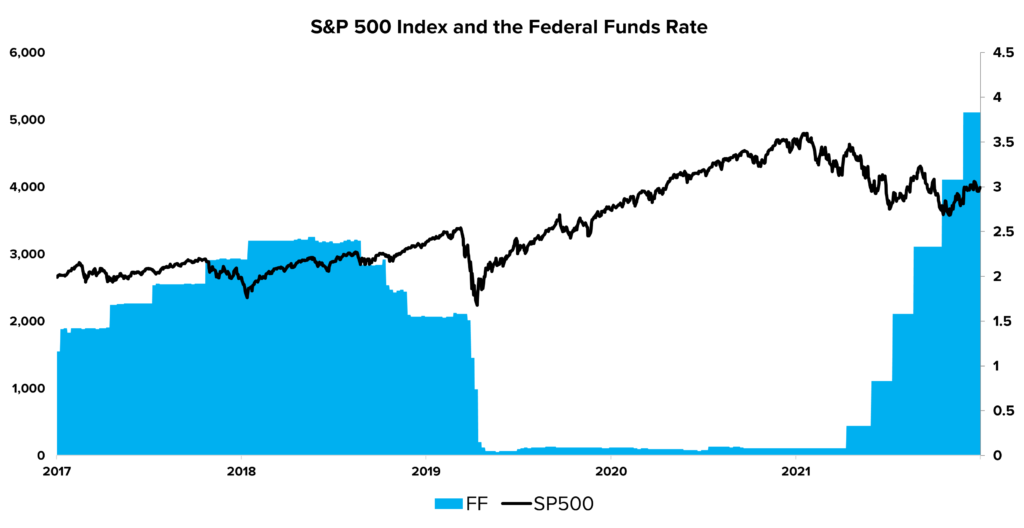
The chart below illustrates the relationship between the S&P 500 Index and the Federal Funds Rate. It is clear that when interest rates are low, the S&P 500 tends to rise, and when interest rates increase, the S&P 500 tends to fall. This relationship may be due to the fact that low interest rates make borrowing cheaper for businesses and individuals, which can lead to increased investment and economic growth, and in turn, higher stock prices. On the other hand, high interest rates can make borrowing more expensive and can act as a drag on economic growth, leading to lower stock prices.
Traders’ Cheat Sheet Table
The table below shows you information about past CPI releases; the Federal Funds Rate at that time – which is the main monetary tool that the Fed uses to “fight” inflation; and the S&P 500 Index’s (SPX) reaction to past CPI releases.
One of the goals of the Federal Reserve is to maintain price stabilty. To meet this objective, the Federal Reserve targets an inflation rate of 2 percent (inflation rates are shown in the “12 month change” column in the table below). That means the Fed wants to see inflation from the same month last year, rise by only around 2 percent.
The last reading showed an increase of 7.4% in the 12-month change column, which was better (the CPI still rose but less than expected which is good) than the estimated change. This led the S&P 500 to finish the day up 5.54%.
| Release Date | CPI | 1 Month Change | 12 Month Change | Fed Funds Rate | S&P 500 1d Reaction | S&P 500 1m Reaction |
|---|---|---|---|---|---|---|
| Dec 13, 2022 | 297.711 | -0.1% | 7.1% | 3.78% | TBD | 7.8% |
| Nov 10, 2022 | 298.012 | 0.4% | 7.4% | 3.08% | 5.54% | 2.1% |
| Oct 13, 2022 | 296.808 | 0.2% | 8.2% | 2.56% | 2.6% | -6.7% |
| Sep 13, 2022 | 296.171 | 0.0% | 8.3% | 2.33% | -4.32% | -6.6% |
| Aug 10, 2022 | 296.276 | 0.0% | 8.5% | 1.68% | 2.13% | 10.7% |
| Jul 13, 2022 | 296.311 | 1.4% | 9.1% | 1.21% | -0.45% | -2.5% |
| Jun 10, 2022 | 292.296 | 1.1% | 8.6% | 0.77% | -2.91% | -0.9% |
| May 11, 2022 | 289.109 | 0.6% | 8.3% | 0.33% | -1.65% | -10.5% |
| Apr 12, 2022 | 287.504 | 1.3% | 8.5% | 0.2% | -0.34% | 3.2% |
| Mar 10, 2022 | 283.716 | 0.9% | 7.9% | 0.08% | -0.43% | -5.4% |
| Feb 10, 2022 | 281.148 | 0.8% | 7.5% | 0.08% | -1.81% | -4.7% |
| Jan 12, 2022 | 278.802 | 0.3% | 7.0% | 0.08% | 0.28% | 0.3% |
| Dec 10, 2021 | 277.948 | 0.5% | 6.8% | 0.08% | 0.95% | 1.4% |
The data in the table is based on the Consumer Price Index for All Urban Consumers: All Items in U.S. City Average, provided by FRED
Release Date – The actual release date of the CPI by the U.S. Bureau of Labor Statistics
CPI – The Consumer Price Index level (in points) that was released
1-Month Change – The % change from the previous month index level to current month
12-Month Change – The % change between the CPI level 12 months ago and in the current month
Federal Funds Rate – The level of the Federal Funds Rate during the time of the CPI release. The Federal Funds Rate is the interest rate at which depository institutions trade federal funds (balances held at Federal Reserve Banks) with each other overnight.
S&P 500 1d Reaction – The % change between the closing price of the S&P 500 prior to the CPI release, and the closing price of the S&P 500 on the day when the CPI was released.
S&P 500 1m Reaction – The % change between the closing price of the S&P 500 after the previous CPI release, and the closing price of the S&P 500 on the day when the following CPI was released.

Questions or Comments about the article? Write to editor@tipranks.com