TipRanks is delighted to announce that you can now conduct advanced research on your favorite Exchange-Traded Fund (ETF) through TipRanks’ unique platform. TipRanks is the first and only platform to provide Wall Street analyst forecasts and price targets for individual ETFs. This launch will change the way investors understand and research ETFs.
Don't Miss our Black Friday Offers:
- Unlock your investing potential with TipRanks Premium - Now At 40% OFF!
- Make smarter investments with weekly expert stock picks from the Smart Investor Newsletter
How Has TipRanks Achieved This Feat?
TipRanks uses its proprietary technology to calculate the analyst forecast and price targets for ETFs based on a combination of the individual performances of the underlying assets. At a glance, you will see the overall analyst rating, analyst price target, and upside or downside on an ETF.
Innovatively, we calculate a weighted average number based on the combination of all the ETF’s holdings. For instance, the average price forecast for an ETF is calculated by multiplying each individual holding’s price targets by its weight (allocation) in the ETF.
How to Find the Analyst Forecasts Page
To begin, search for the ETF you are researching using the search bar, by entering either the name of the fund or its ticker symbol. By default, when searching for an ETF, it will take you first to the ETF Analysis page. The Analyst Forecasts page appears on the menu on the left-hand side of the screen.

How to Use the Analyst Forecast Page
Just as you study the analyst forecast for a stock on the TipRanks website, you can now study the analysts’ consensus view on ETFs before deciding to invest in them. Let’s learn more about the forecast page with the help of a popular ETF, the SPDR S&P 500 ETF Trust (SPY).

# Analyst Rating
SPY is an equity-only ETF with 505 holdings in its portfolio. TipRanks accumulates analyst ratings of all the 505 holdings of SPY to derive a consensus rating, while also giving the breakdown of Buy, Sell, and Hold recommendations.
As seen in the chart above, a total of 6,059 analysts have given ratings for all of SPY’s holdings combined, during the past three months. Out of this, 56.33% have given a Buy rating, 37.42% have given a Hold rating, and 6.26% have given SPY a Sell rating. This results in SPY getting an overall Moderate Buy consensus rating on TipRanks.
# Analyst Price Target
As seen in the chart, the average SPDR S&P 500 ETF Trust price target is $470.66. This price target is derived by calculating a weighted average number of all the price targets of individual holdings in the ETF.
The closing price for SPY on February 22, 2023, was $398.54. The average target price of $470.66 implies 18.1% upside potential from the last closing price. It is important to note that this upside or downside potential for the average target price will change daily, based on the closing price each day.
You can also see the highest target price and lowest target price for the ETF; those indicate the most bullish and most conservative price target recommendation for the portfolio. In the case of SPY, the highest price target of $571.15 implies 43.3% upside potential, while the lowest price target of $384.07 implies 3.6% downside potential from current levels.
# Top Analyst Recommendations
A very interesting feature of TipRanks’ analyst forecast and price target page is that you can also switch between viewing the overall analysts’ consensus and only the top analysts’ consensus for stocks or ETFs.
Just above the consensus chart, you can see a taskbar that allows you to choose between the two, as shown in the charts below.

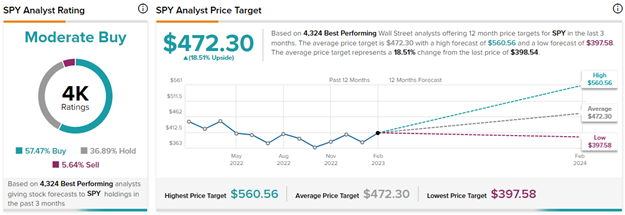
For SPY, when we select only the top analysts’ consensus, the numbers change, as shown in the chart below. The top analysts are those with the highest success rates on their stock ratings, according to TipRanks’ ranking system.

As you can see, per 4,324 ratings from top analysts, SPY has an average price target of $472.30, implying an 18.5% upside potential from current levels.
# Stocks With Upside/Downside Potential
Surprised by what you read until now? Well, we have more. Along with giving ETF forecasts and price targets, TipRanks also gives a list of the stocks included in the ETF with the highest upside potential and the lowest downside potential. This way, you also get a sneak peek into the top-performing and poorly-performing stocks from the ETF holdings. You can also click on individual stocks in the list to further research them.

Now, go ahead and explore the new forecast and price target page to better analyze an ETF before making an investment decision. See which ETF best suits your risk-reward appetite and invest. You can even easily choose to follow the ETF or add it to your TipRanks Portfolio by clicking on the relevant buttons on the top right side of the page.


