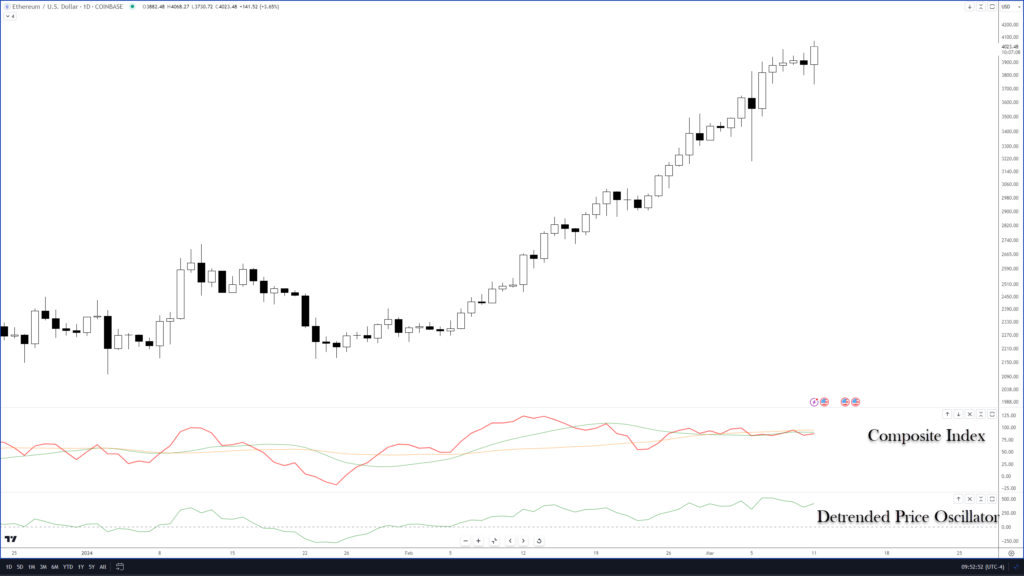
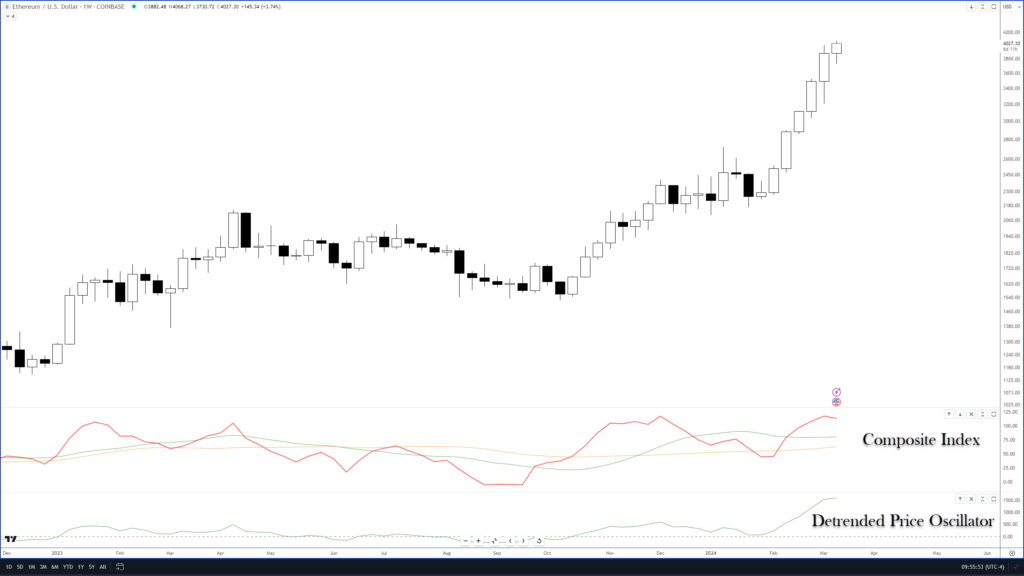
Ethereum’s (ETH-USD) levels are currently under scrutiny as cryptocurrency analysts and investors peer into its performance after breaking the $4,000 value area – a level not seen for ETH since December 2021.
As the leading altcoin and second most valuable cryptocurrency by market cap behind Bitcoin (BTC-USD), Ethereum has fundamentally redefined how applications are built and operated on the Internet. It boasts a robust ecosystem that supports smart contracts and decentralized applications (dapps).
This in-depth analysis of the daily and weekly charts reveals a nuanced picture: weekly indicators signal caution, while daily trends suggest resilience and potential for continued upward momentum.
Analysis of the Daily Chart: Potential for Continued Uptrend

Ethereum’s technical conditions on the daily chart exhibit signs of bearish sentiment. The Composite Index, a crucial momentum indicator, has decisively crossed below its moving averages and is a bearish warning sign, indicating potential downward pressure on price.
However, it is essential to consider the Detrended Price Oscillator (DPO), which remains above the zero line. The DPO’s position indicates underlying strength, suggesting that the prior uptrend may continue despite the immediate bearish outlook.
Insights from the Weekly Chart: Indicators Suggest Caution

Expanding our analysis to the weekly timeframe reveals a broader perspective of Ethereum’s market trajectory. The trendlines, extending back to July 2022, illustrate a dominant upward trend, with the recent steepening slope suggesting a parabolic rise.
The immediate support level on this parabolic trendline is identified at $3,687. Furthermore, the Composite Index has reached historical resistance levels and shows a downward slope, while the DPO marks its highest levels since August 2021, signaling potential volatility.
The Outlook Is Mixed
While long-term indicators suggest a cautious approach due to bearish signals, hidden strength on the daily chart and the strong support levels identified on the weekly chart offer a counterbalance. These insights suggest that while near-term volatility is likely, given the increased institutional interest in Ethereum and a broader bullish mood for crypto, a resumption of the uptrend has a strong probability of occurring.


