Shares of software company Cadence Design Systems (CDNS) gained in today’s trading as investors await its Q2 earnings results on July 22 after the market closes. Analysts are expecting earnings per share to come in at $1.23 on revenue of $4.595 billion. This equates to 0.8% and 12.2% year-over-year increases, respectively, according to TipRanks’ data.
Don't Miss Our Christmas Offers:
- Discover the latest stocks recommended by top Wall Street analysts, all in one place with Analyst Top Stocks
- Make smarter investments with weekly expert stock picks from the Smart Investor Newsletter
Ideally, earnings per share should grow faster than revenue as this demonstrates a high degree of operating and financial leverage in the business. Nevertheless, it’s worth noting that CDNS has beaten earnings estimates every quarter since its 2020 Q3. Therefore, it’s possible that EPS growth will outpace revenue growth.
Options Traders Anticipate a Large Move
Using TipRanks’ Options tool, we can see what options traders are expecting from the stock immediately after its earnings report. The expected earnings move is determined by calculating the at-the-money straddle of the options closest to expiration after the earnings announcement. If this sounds complicated, don’t worry, the Options tool does this for you. Indeed, it currently says that options traders are expecting a large 8.15% move in either direction.

Is CDNS Stock a Buy?
Turning to Wall Street, analysts have a Strong Buy consensus rating on CDNS stock based on six Buys, one Hold, and zero Sells assigned in the past three months. After a 17% rally in its share price over the past year, the average CDNS price target of $340.57 per share implies 21.65% upside potential.

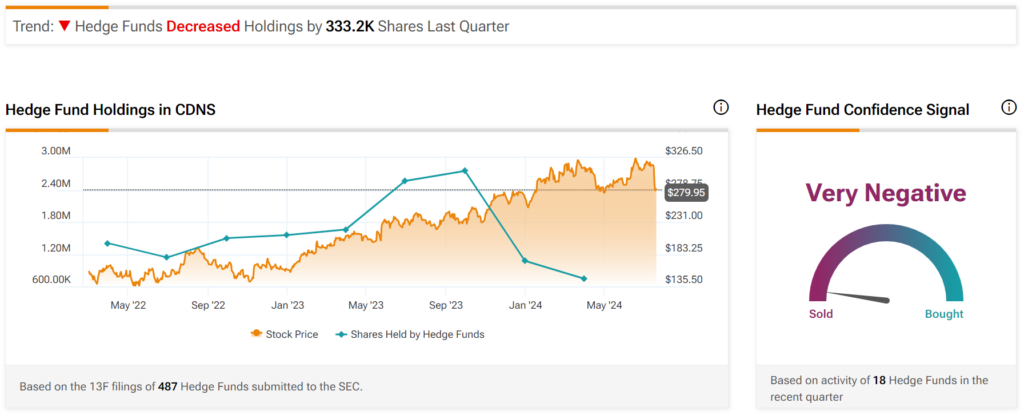
Interestingly, hedge funds seem to disagree. When it comes to “smart money,” money managers don’t seem to be all that confident in CDNS stock. Indeed, hedge funds decreased their holdings in the stock by 333,200 shares in the past quarter. As a result, they have a very negative confidence signal, as indicated by the graphic below.


