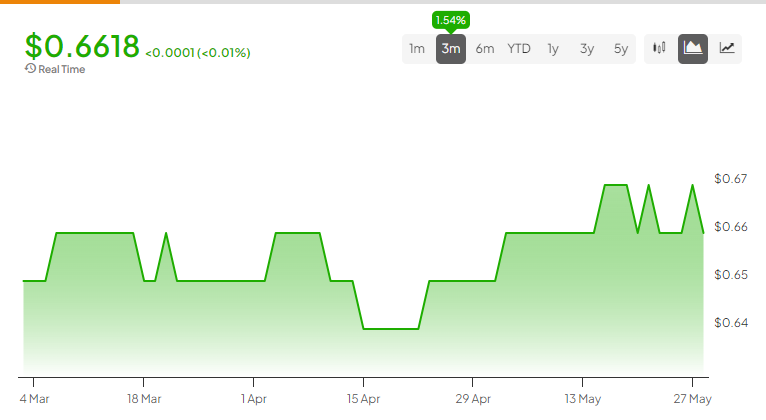
Over the past month, the AUD-USD exchange rate has fluctuated due to global economic uncertainties, central bank decisions, and surprising economic data. From April 29 to May 29, the Australian dollar navigated through dramatic drops, modest recoveries, and notable surges. Here’s a week-by-week overview of how the AUD-USD pair performed during this eventful period.
Maximize Your Portfolio with Data Driven Insights:
- Leverage the power of TipRanks' Smart Score, a data-driven tool to help you uncover top performing stocks and make informed investment decisions.
- Monitor your stock picks and compare them to top Wall Street Analysts' recommendations with Your Smart Portfolio
Week 1 (April 29 – May 5)
- April 29: 0.6566
- May 5: 0.6608
- Change: +0.64%
The first week saw the AUD-USD on a bit of a roller coaster. April 30 was a disaster with a drop to 0.6472, thanks to a mix of global economic jitters and geopolitical drama driving investors towards the safer USD. But hey, the Aussie clawed back some gains by the end of the week, stabilizing at 0.6608. The RBA kept interest rates steady, which helped things a bit.
Week 2 (May 6 – May 12)
- May 6: 0.6624
- May 12: 0.6603
- Change: -0.32%
The second week was a yawn-fest. The RBA sticking to its guns on interest rates made the market snooze. Add some geopolitical tension, and you have a minor sell-off with investors running to the USD like it’s the last slice of pizza at a party.
Week 3 (May 13 – May 19)
- May 13: 0.6607
- May 19: 0.6692
- Change: +1.28%
The third week was all about the comeback. The Aussie dollar surged to 0.6700, driven by surprisingly positive Australian economic data and speculation that the U.S. Fed might pause rate hikes. Consumer confidence and retail sales were the unexpected hits, giving the AUD a much-needed boost.
Week 4 (May 20 – May 26)
- May 20: 0.6667
- May 26: 0.6627
- Change: -0.60%
Week four was mixed. The pair dipped to 0.6618 on May 22, reflecting the confusion from the Fed’s Beige Book report. It was like watching a bad reality show—unpredictable and cringe-worthy. With no clear direction, the AUD-USD pair stumbled around like it had one too many.
Week 5 (May 27 – May 29)
- May 27: 0.6651
- May 29: 0.6618
- Change: -0.50%
The final days of May were as exciting as a tax seminar. The pair hovered around 0.6618, with minor fluctuations. Investors played it safe, waiting for the next round of economic data and central bank updates, because why make a move when you can just sit tight and stare at the screen?
So, there you have it. The AUD-USD pair took us on a bit of a ride over the past 30 days, from sharp drops to sudden climbs, all underpinned by central bank decisions, economic data surprises, and the usual global market shenanigans. Fun times in Forex land.
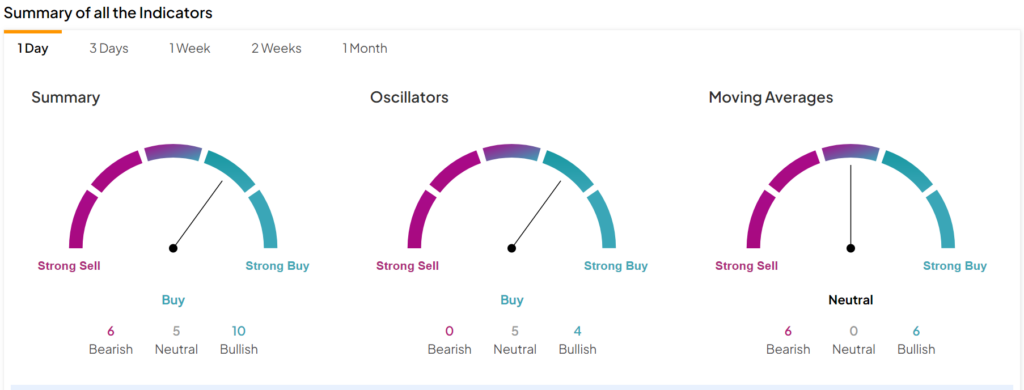
Is AUD-USD a Buy?
Using TipRanks’ technical analysis tool, the indicators seem to point to a positive outlook. Indeed, the summary section pictured below shows that 10 indicators are Bullish, compared to five Neutral and six Bearish indicators.