Spotify (SPOT) is about to report earnings today (February 2, 2021) after market close. Let’s take a deep dive into its monthly usage and other key performance indicators and see if we can gain insights into its likely financial performance for the quarter.
One of the company’s performance metrics is MAU’s, defined by the company as “an indicator of the size of the audience engaged with our Service. We define MAUs as the total count of Ad-Supported Users and Premium Subscribers that have consumed content for greater than zero milliseconds in the last thirty days from the period-end indicated.”
Therefore, using TipRanks’ new tool that measures website visits, we can try and predict how well Spotify has performed in the to-be-reported quarter.
SPOT Monthly Product Usage
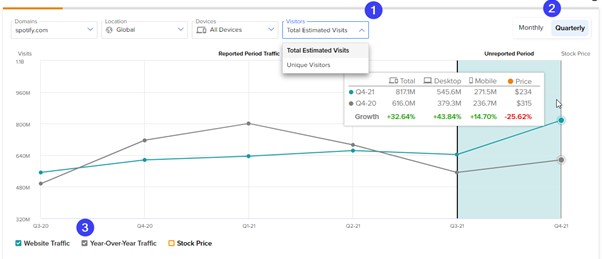
Looking at the tool, we can see that for the quarter that the company is about to report on, the total estimated visitors to Spotify is up from the previous quarter and up significantly (around 30%) from the same quarter last year. We can also see that the end of the year quarter usually shows strong growth at Spotify.

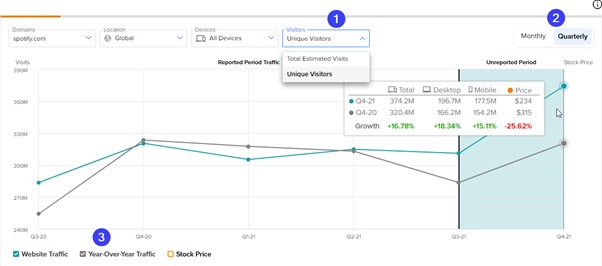
When looking at unique total visits we can also see very strong growth this quarter, up around 20% from the previous quarter. This comes on the tails of a long period of stagnation in growth. It is also up around 17% from the same quarter last year. Another trend we can see is that usually, Spotify’s Q4 is its best quarter, in terms of growth.

SPOT Stock Chart
If we look at the SPOT stock chart, we can see that currently the stock is at prices from which it has bounced in the past year.

Based on these findings, let’s see what we can anticipate for Q4, 2021:
Total Estimated Visits
Total visits are up from the previous quarter as well as from the same quarter last year. This is a positive sign.
Total Estimated Unique Visits
Total unique visits are up from the previous quarter and up from the same quarter last year – another positive sign.
Stock Chart and Prices
Stock price has declined almost 30% since November 21, along with the rest of the market. However, current stock price is at bounce levels, which is a good sign for the stock’s performance.
Additional Insights
Using tools from SEMRUSH (SEMR), we checked the performance of Spotify.com pages (desktop only) that have URLs with the text “purchase” in them. Example of such pages are spotify.com/us/purchase/success/premium or spotify.com/uk/purchase/offer/holiday-2020-trial-3m.
Visits to these kind of URL’s should suggest a successful purchase of a Spotify account.
The data shows that the total visits to pages containing the word “purchase” grew by about 36% from the previous quarter and by 188% from the same quarter last year. Those findings indicate significant growth in new users.
Conclusion
There are many possibilities of how a stock price will react post earnings; management commentary and guidance definitely play a role.
However, in the case of Spotify, if we consider only the website visits data as explained above, it seems like there is more potential for an upside move than for a downside move, post-earnings.
Download the TipRanks mobile app now
Read full Disclaimer & Disclosure


