The Invesco S&P 500 Equal Weight ETF (NYSEARCA:RSP) offers investors equally weighted exposure to the S&P 500 index. In other words, it’s not overly concentrated in one particular sector or stock. Why is this something investors might be interested in? Let’s find out.
What is an Equal-Weight S&P 500 ETF?
RSP can be thought of as an alternative way to invest in the S&P 500, the index that tracks the performance of 500 of the largest publicly-listed companies in the United States and, in many ways, serves as a proxy for the U.S. stock market as a whole.
Most ETFs that track an index like the S&P 500 are weighted by market cap, meaning that stocks with large market valuations like Apple or Microsoft will account for a higher percentage of the fund’s holdings compared to stocks with lower market caps. These stocks will thus command outsized influence on the results of the fund.
Conversely, RSP uses an equal-weight strategy for the stocks in the S&P 500 Index, meaning that it invests the same amount in each stock and rebalances on a quarterly basis. Because of this process, no individual stock has a disproportionate or overwhelming influence on the overall results of the fund.
Why Go Equal Weight?
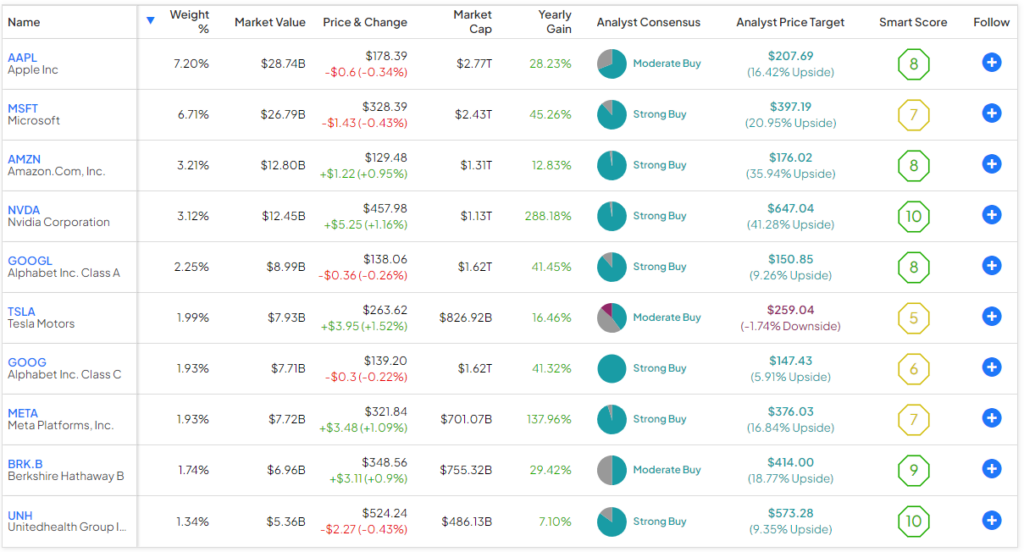
While investing in a typical S&P 500 fund offers investors decent diversification, as this type of ETF owns 500 stocks, these ETFs are not as diversified as they might appear on the surface, given the high concentration they have in their top holdings. For example, the largest S&P 500 ETF, the SPDR S&P 500 ETF Trust (NYSEARCA:SPY), owns 504 stocks, but SPY’s top 10 holdings make up nearly one-third of assets. This is because mega-cap tech stocks like Apple and Microsoft account for large positions in this market-weighted fund, given their immense market caps.
Below, you can take a look at SPY’s top 10 holdings, which account for 31.4% of the fund.

This isn’t necessarily a bad thing, as these stocks have been strong performers this year, but it does leave investors with more concentration risk and more exposure to just a handful of stocks.
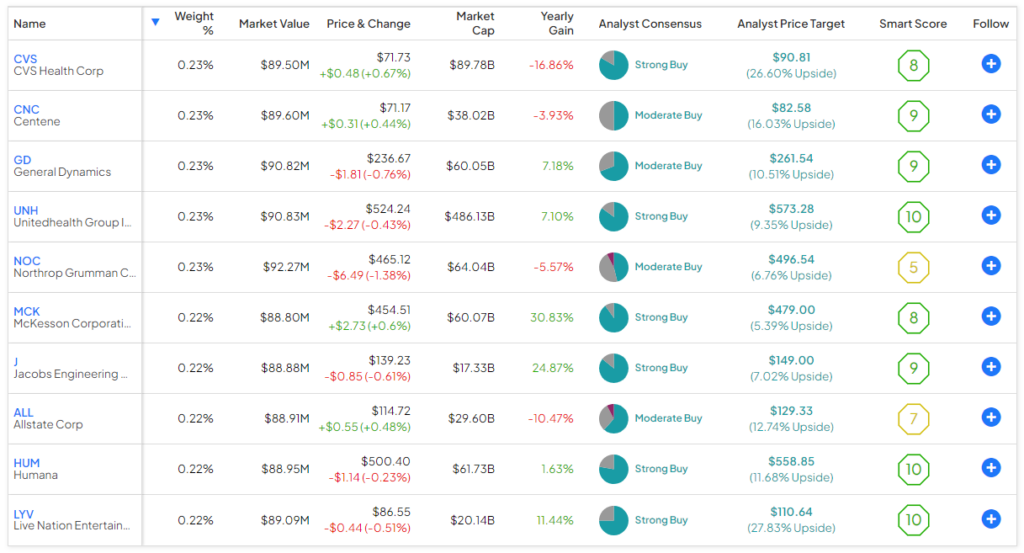
Conversely, because they all start with a weighting of 0.2% each quarter, RSP’s top 10 holdings make up just a minuscule 2.3% of the fund. This shields investors from concentration risk and gives them more exposure to smaller components of the S&P 500, which can otherwise be crowded out by the mega-cap tech stocks in market-weighted S&P 500 ETFs. Below, you can take a look at RSP’s top 10 holdings.

Furthermore, if Apple, Microsoft, or big tech as a whole experience a pullback, this will have more of a pronounced effect on SPY than it will on RSP, where these stocks are weighted equally with every other stock in the S&P 500.
A lot has been written of the fact that the “Magnificent Seven” stocks like Apple, Microsoft, and their fellow mega-cap tech peers have driven much of the market’s gains this year. For example, Apple is up 41.9% year-to-date, Microsoft is up 36.6% year-to-date, and Nvidia is up an incredible 219.7% in 2023. Because of this, some analysts and observers feel that these mega-cap tech stocks are due for a pullback after the tremendous runs they have enjoyed in 2023.
At the very least, there could be some reversion to the mean as other stocks catch up with the market’s current leaders, so an equal-weighted fund like RSP could be the right type of ETF to own in the current climate.
Performance Comparison
As you might guess, RSP has underperformed the S&P 500 so far this year (with a total return of 1.3% versus 14.8% for the S&P 500), given that by design, it doesn’t have as much exposure to the Magnificent Seven stocks that have done much of the heavy lifting for the market this year.
However, RSP has still put up a solid return, and when you zoom out beyond the past year, there is much less of a disparity. For example, over the past three years (as of the end of September), RSP has actually outperformed the S&P 500 with a total return of 11.5% versus a total return of 10.2% for the S&P 500 Index.
RSP has slightly underperformed the S&P 500 over the past five and 10 years, with annualized five- and 10-year returns of 8.0% and 10.2%, respectively, versus annualized returns of 9.9% and 11.9% for the S&P 500 over the same respective time frames.
So, RSP has outperformed the S&P 500 over the past three years, and while it has underperformed it slightly over the past five and 10 years, it could be well-positioned against the market-weighted index in a market environment where the mega-cap tech stocks revert to the mean.
Is RSP Stock a Buy, According to Analysts?
Turning to Wall Street, RSP earns a Moderate Buy consensus rating based on 403 Buys, 93 Holds, and eight Sell ratings assigned in the past three months. The average RSP stock price target of $169.82 implies 19.5% upside potential.

Reasonable Expense Ratio
Additionally, RSP is a cost-effective option for investors, with a reasonable expense ratio of 0.20%. This means that an investor allocating $10,000 into the ETF would pay $20 in fees during their first year of investing in the fund. Assuming that the expense ratio remains at 0.20% and that the fund returns 5% per year going forward, this investor would pay $255 in fees over the course of a 10-year investment.
The Takeaway
Investing in RSP gives investors many of the same benefits that they get from investing in the S&P 500 — exposure to over 500 of the United States’ best and brightest companies. However, it does so with much less concentration risk than the typical market-weighted S&P 500 fund, as it isn’t dominated by the big tech stocks like these funds are.
I view RSP as an interesting and sensible ETF that can allow investors to gain exposure to the S&P 500 while hedging against the risk of a reversion to the mean of the market’s big year-to-date winners.


