


Johnson & Johnson (JNJ) is a manufacturer of health care products that are sold worldwide. We are neutral on the stock.
Competitive Advantage
There are a couple of ways to quantify a company’s competitive advantage, using only its income statement. The first method involves calculating the earnings power value (EPV).
Earnings power value is measured as adjusted EBIT after tax, divided by the weighted average cost of capital, and reproduction value can be measured using total asset value. If earnings power value is higher than reproduction value, then a company is considered to have a competitive advantage.
The calculation is as follows:
EPV = EPV adjusted earnings / WACC
$390 billion = $23.4 billion / 0.06
Since Johnson & Johnson has a total asset value of $179.2 billion, we can say that it does have a competitive advantage. In other words, assuming no growth for Johnson & Johnson, it would require $179.2 billion of assets to generate $390 billion in value over time.
The second method is looking at a company’s gross margins, because it represents the premium that consumers are willing to pay over the cost of a product or service. A sustained high gross margin indicates that a competitive advantage is present. If an existing company has no edge, then new entrants would gradually take away market share, leading to decreasing gross margins as pricing wars ensue to remain competitive.
For Johnson & Johnson, gross margins have remained high although stable in the past several years, in the mid-to-high 60% range. As a result, its gross margins indicate that a competitive advantage is present in this regard as well.
Risks
To measure Johnson & Johnson’s risk, we will first check to see if financial leverage is an issue. We do this by comparing its total debt-to-free cash flow. Currently, this number stands at 1.5.
Overall, we don’t believe that debt is currently a material risk for the company because its interest coverage ratio is 99.6 (calculated as EBIT divided by interest expense).
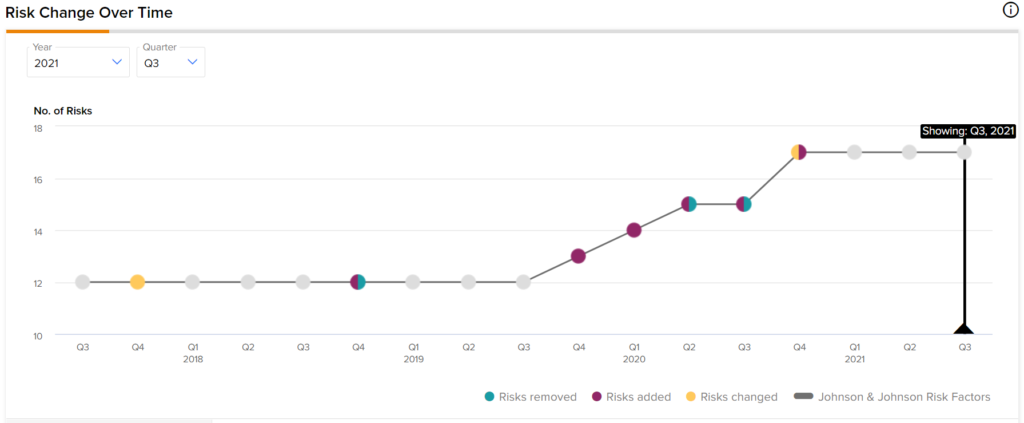
However, there are other risks associated with Johnson & Johnson. According to Tipranks’ Risk Analysis, JNJ has disclosed 17 risks in its most recent earnings report. The highest amount of risk came from the Legal & Regulatory category.
The total number of risks has increased over time, as shown in the picture below.
Valuation
To value Johnson & Johnson, we will use a single-stage DCF model because it’s a mature company that mostly sees single-digit growth. For the terminal growth rate, we will use the 30-year U.S. Treasury yield as a proxy for expected long-term GDP growth.
Our calculation is as follows:
Fair Value = FCF per share / (Discount Rate – Terminal Growth)
$219.85 = $8.53 / (0.06 – 0.0212)
As a result, we estimate that the fair value of Johnson & Johnson is approximately $219.85 under current market conditions. In contrast, the stock is currently trading at $171.63.
Wall Street’s Take
Turning to Wall Street, Johnson & Johnson has a Strong Buy consensus rating, based on six Buys, one Hold, and zero Sells assigned in the past three months. The average Johnson & Johnson price target of $186.89 implies 9.4% upside potential.

Final Thoughts
JNJ is an industry giant with a very large and measurable competitive advantage. In addition, it is currently undervalued under current market conditions, both from our estimates and those of analysts. That said, given the expanding risks, there isn’t much of a margin of safety, which is why we are neutral on the stock.
Download the TipRanks mobile app now
To find good ideas for stocks trading at attractive valuations, visit TipRanks’ Best Stocks to Buy, a newly launched tool that unites all of TipRanks’ equity insights.
Read full Disclaimer & Disclosure
