Working with TipRanks
Follow Us


Stocks
ETFs
Options
Commodities
Crypto
Currency
Research Tools
Calendars
Economic Indicators
Calculators
Education
About Us
Working with TipRanks
Follow Us
Top Smart Score Stocks - Australia
Top Smart Score Stocks displays the best stocks according to the TipRanks Smart Score. This unique score measures stocks on their potential to outperform the market, based on 8 key factors. These include how the best performing analysts are rating stocks, whether hedge funds are buying or selling, as well as fundamental and technical factors.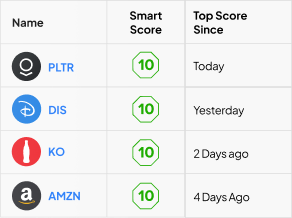
Stocks With Highest Smart Score
Name | Price | Price Change | Sector | Top Score Since | Market Cap | P/E Ratio | Yearly Gain | Price Chart (7D) | Smart Score | Follow |
|---|---|---|---|---|---|---|---|---|---|---|
xxxxxxxxxxxxxxxxxxxxxxxxxxx | AU$32.13 | 0.82 (2.49%) | Healthcare | AU$47.52B | 33.37 | -2.80% | ||||
xxxxxxxxxxxxxxxxxxxxxxxxxxx | AU$1.33 | 0.02 (1.52%) | Communication Services | AU$656.34M | -15.50 | 82.93% | ||||
xxxxxxxxxxxxxxxxxxxxxxxxxxx | AU$26.76 | 0.22 (0.82%) | Financial | AU$15.98B | 29.08 | 19.46% | ||||
xxxxxxxxxxxxxxxxxxxxxxxxxxx | AU$4.47 | 0.11 (2.4%) | Energy | AU$700.01M | -89.45 | 217.02% | ||||
xxxxxxxxxxxxxxxxxxxxxxxxxxx | AU$12.17 | 0.02 (0.16%) | Real Estate | AU$5.78B | -26.24 | 9.75% | ||||
xxxxxxxxxxxxxxxxxxxxxxxxxxx | AU$1.16 | 0.018 (1.49%) | Real Estate | AU$1.04B | 40.88 | -0.85% | ||||
xxxxxxxxxxxxxxxxxxxxxxxxxxx | AU$3.86 | 0.025 (0.64%) | Consumer Defensive | AU$4.26B | 13.76 | -3.76% | ||||
xxxxxxxxxxxxxxxxxxxxxxxxxxx | AU$2.68 | 0.03 (1.11%) | Industrials | AU$6.06B | 129.52 | 0.00% | ||||
xxxxxxxxxxxxxxxxxxxxxxxxxxx | AU$3.65 | 0 (0%) | Financial | AU$10.05B | 16.19 | -1.65% | ||||
xxxxxxxxxxxxxxxxxxxxxxxxxxx | AU$9.78 | 0.32 (3.17%) | Consumer Cyclical | AU$1.42B | 13.70 | 6.75% | ||||
xxxxxxxxxxxxxxxxxxxxxxxxxxx | AU$7.72 | 0.075 (0.96%) | Energy | AU$6.51B | 5.67 | 8.42% | ||||
xxxxxxxxxxxxxxxxxxxxxxxxxxx | AU$7.67 | 0.11 (1.41%) | Technology | AU$1.21B | 29.10 | 11.92% |
FAQ
Which stock should a beginner buy?
Whether you are a beginner or more of an experienced investor, key factors such as analysts’ ratings, insider transactions and stock fundamentals should be considered prior to adding stocks to a portfolio.
Which stocks have outperformed the market?
How does TipRanks smart score work?
TipRanks' Smart Score is a proprietary quantitative scoring system. Based on eight market key factors, it assigns stocks a score from one to ten. The lowest score is 1 and the highest score is 10. A stock with a high score has a higher potential to outperform the market.