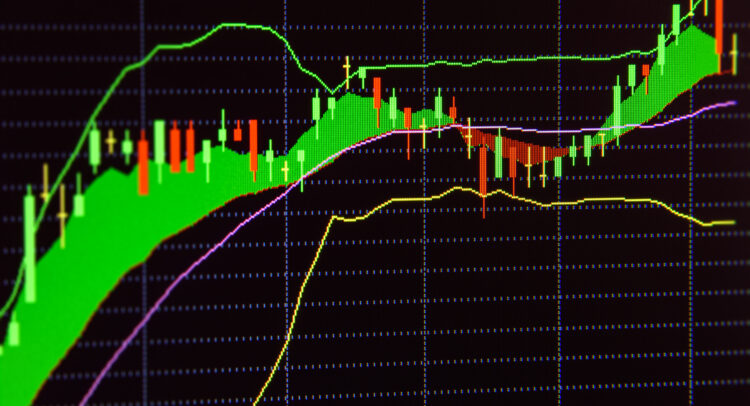
Bollinger Bands might sound like an ’80s rock group, but in the forex markets, they’re indispensable tools for predicting price movements and measuring volatility. Developed by John Bollinger in the 1980s—not in his garage but perhaps at a desk—they have become a mainstay on traders’ screens, much like how avocado complements toast.
Bollinger Bands have three lines running along a price chart. The middle line is a simple moving average (SMA), generally set over 20 periods, serving as a baseline from which prices fluctuate. The other two lines—the real stars of the show—track above and below this average, adjusting to changes in market volatility.
These are the standard deviations that expand and contract like lungs, breathing in market euphoria and exhaling during calmer times. They gauge the mood—thick bands indicate lively market activity; thin bands a quieter phase.
Strategies for Trading with Bollinger Bands
Let’s dive into strategies, not hopes and guesses. Traders use Bollinger Bands to pinpoint when to enter and exit trades—a straightforward yet effective approach. One popular tactic is the Bollinger Bounce, which capitalizes on price movements back to the mean.
When the price touches the upper band, traders look for signs of peaking before initiating a sell; similarly, a touch on the lower band might suggest a buying opportunity.
Another strategy is the Bollinger Squeeze (sometimes just called the Squeeze), which thrives on anticipation during periods when the market is undecided—akin to choosing between a night out or a movie marathon.
This approach exploits the narrowing of the bands, suggesting a drop in volatility and a potentially explosive move once the market picks a direction. The aim is to position oneself just before this decisive move, whether up or down.
While Bollinger Bands won’t foretell the next breaking news, they provide a structured way to interpret market dynamics, aiding traders in making more informed decisions. They are not mere lines on a chart; they represent the market’s pulse, offering insights into its current state. Next time you’re analyzing a chart, remember: it’s the nuanced swings between the highs and lows that matter.
Don’t let crypto give you a run for your money. Track coin prices here


